Unless Congress acts to end the shutdown, or the Trump administration and USDA reverse course, millions of Americans could see their food benefits cut off November 1 — when Supplemental Nutrition Assistance Program (SNAP) payments halt nationwide.
Often referred to as “food stamps,” and sometimes with a negative connotation, SNAP has long operated through Electronic Benefit Transfer (EBT) cards, accepted at more than 250,000 grocery stores and markets across the U.S.
For some, SNAP is just a statistic.
For others, it’s a lifeline.
📍 Western Kentucky Snapshot
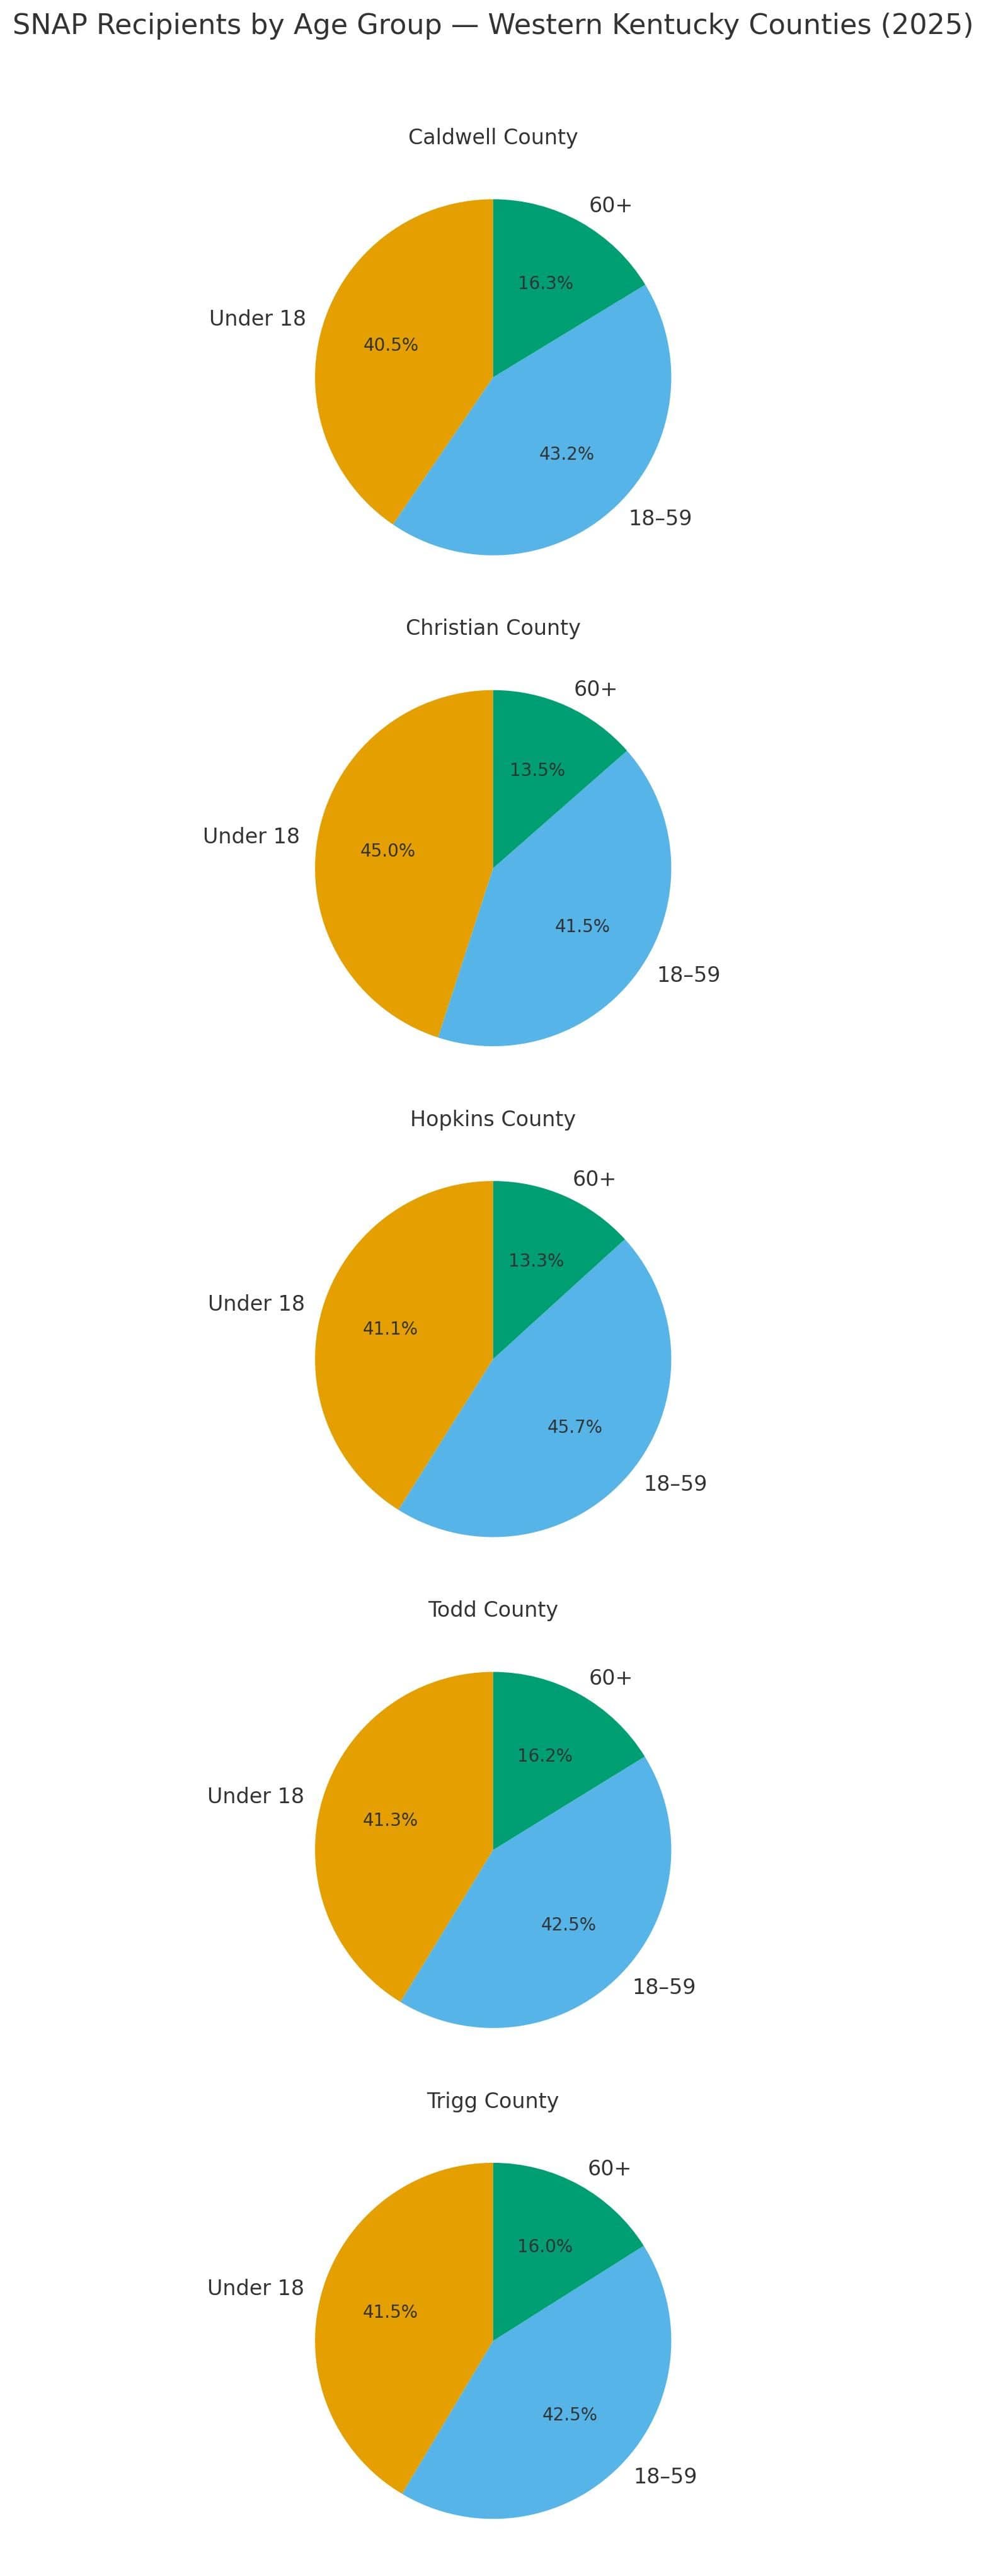
According to the Kentucky Cabinet for Health and Family Services, five local counties — Caldwell, Christian, Hopkins, Todd, and Trigg — have more than 19,500 residents with some level of SNAP assistance.
That’s 7,000 more people than Trigg County’s total population.
| County | % of Population | Households | Avg. Benefit | Total Paid (Last Month) |
|---|---|---|---|---|
| Caldwell | 12.7% | 774 | $322 | $249,000 |
| Christian | 12.2% | 4,218 | $353 | $1.49M |
| Hopkins | 14% | 3,063 | $349 | $1.07M |
| Todd | 11% | 647 | $345 | $220,000 |
| Trigg | 10.6% | 724 | $343 | $240,000 |
Demographically, recipients here are largely White (70–80%), with 10–16% Black or African American, and fewer than 7% Hispanic-Latino in each county.
Furthermore, more than 40% of those who receive SNAP benefits in these five counties are 18 or younger.
📊 Kentucky SNAP at a Glance
From the Center on Budget and Policy Priorities (CBPP):
-
595,000 Kentuckians (13%) receive SNAP — roughly 1 in 8 residents.
-
68% of participants are in families with children.
-
38% are in households with an elderly or disabled member.
-
38% are part of working families — holding full or part-time jobs.
-
In Fiscal Year 2022:
-
14% of households were food insecure.
-
16% of residents lived below the poverty line.
-
21% of children lived in poverty.
-
12% of older adults lived in poverty.
-
Between 2015–2019, SNAP lifted about 94,000 Kentuckians above the poverty line, including 37,000 children.
💵 Who Qualifies for SNAP?
Eligibility depends on income and family size:
-
Gross income ≤ 130% of the federal poverty level.
-
For a family of three in 2025: about $33,500 a year, or $2,800/month.
-
-
Assets capped at $3,000 (or $4,500 if a member is elderly or disabled).
-
Recipients must be U.S. citizens or lawfully present immigrants.
A two-adult household earning minimum wage ($7.25/hour) full-time brings in $2,320/month — still below the SNAP threshold.
📉 Local Wages vs. Food Costs
Average weekly wages, per U.S. Bureau of Labor Statistics (Q1 2025):
-
Christian – $1,096
-
Hopkins – $1,090
-
Todd – $900
-
Caldwell – $840
-
Trigg – $771
Meanwhile, the national average grocery cost for a family of three is around $800/month — leaving many households with razor-thin margins.
🧾 How Accurate Is SNAP?
The Food and Nutrition Service (FNS) reports a 95.6% payment accuracy rate, meaning most benefits reach the right households in the right amounts.
The Government Accountability Office (GAO) estimates an 11.7% “improper payment” rate, which includes errors, fraud, and misuse.
Actual fraud — such as selling or trading SNAP benefits — remains below 1% of all transactions.
⚙️ What’s Changing Under the 2025 “Megabill”
-
Adults 18–64 without children must work or train 20 hours a week to stay eligible.
-
Some legal immigrants lost access altogether.
-
Utility deductions were revised, cutting benefits for some.
If payments resume, the 2026 maximum benefit for a family of three would be $785/month — about $188 per person.
🚨 Beyond SNAP
Other federal aid programs like WIC, LIHEAP, and Head Start could also face delays or interruptions during the government shutdown.
The Bottom Line
- Food pantries in the region, particularly heading into Thanksgiving and Christmas, will need more help — both with hands and finances — during the holiday season.
- Shopping, especially going into Black Friday, Christmas and New Year’s, will cool regionally — especially as individuals and families make difficult decisions.
- Public and private schools, as well as after-school programming, should be prepared for considerable needs.
Sources
- Center on Budget and Policy Priorities — “Kentucky (SNAP Factsheet)”, Jan 21 2025.
- United States Department of Agriculture (USDA) / Food & Nutrition Service — “SNAP Payment Error Rates by State, FY 2023”.
- USDA / FNS — “Annual SNAP Payment Error Rates for FY 2024: national rate 10.93%”.
- United States Government Accountability Office (GAO) — “Improper Payments: USDA’s Oversight of the Supplemental Nutrition Assistance Program (SNAP)”, September 26 2024.
- Kentucky state participation and economic data — via Kentucky Youth Advocates tracking article “Tracking SNAP in Kentucky”.
- Kentucky county-level SNAP participation details as reported in local media (e.g., for Caldwell, Christian, Hopkins, Todd, Trigg Counties) — via recent news coverage.
- ChatGPT for formatting, concision and redundancies.